Medical billing KPIs (key performance indicators) show whether your revenue cycle turns care into cash quickly and completely. A handful of numbers, tracked the same way every month, will tell you more than any stack of reports: how much of what you are owed you actually collect, how many claims go out clean, how many come back denied and how long money takes to arrive. Here are the 10 metrics worth tracking, the formulas, and the benchmarks practices commonly aim for.
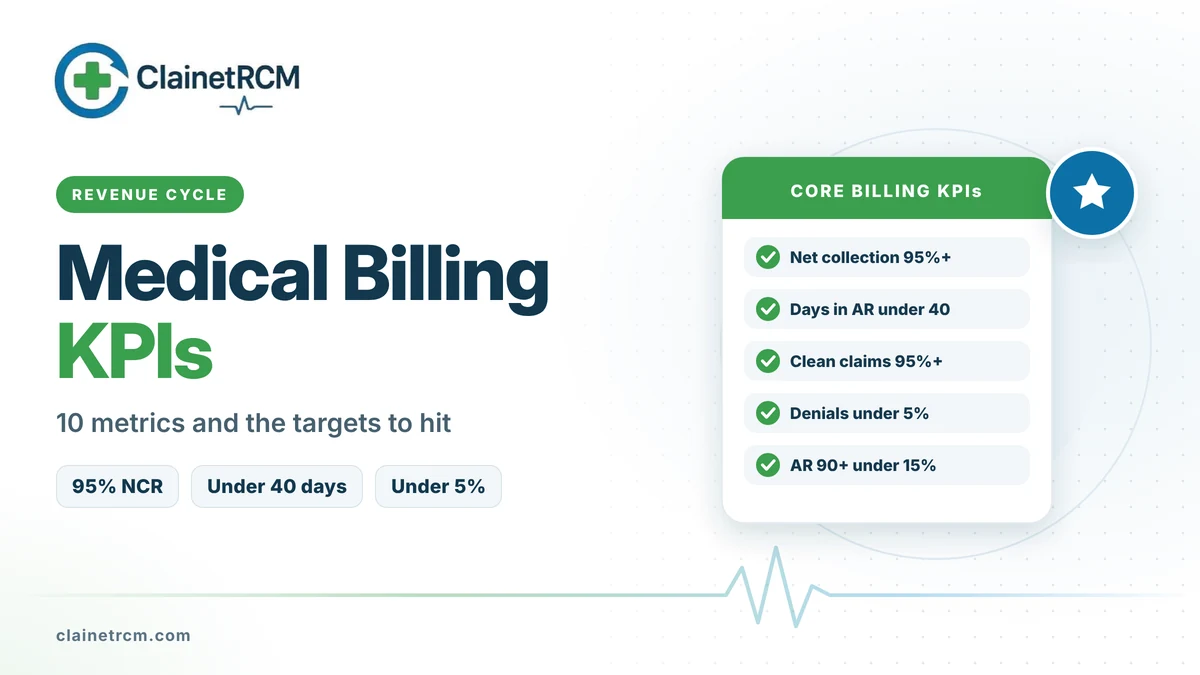
Quick answer: Start with five core metrics: a net collection rate of 95% or higher, days in AR under 40, a clean claim rate of 95% or higher, a denial rate under 5% to 10%, and AR over 90 days under about 15% of total AR. Add charge lag, first-pass resolution rate, denial overturn rate, point-of-service collections and cost to collect for a complete picture. Compare against your own trend first, then against practices in your specialty.
The 10 Medical Billing KPIs at a Glance
| KPI | Formula | Commonly cited target |
|---|---|---|
| Net collection rate | Payments ÷ (charges − contractual adjustments) | 95% or higher |
| Days in AR | Total AR ÷ average daily charges | Under 40 days; under 30 is strong |
| Clean claim rate | Claims accepted on first submission without edits or rejections ÷ claims submitted | 95% or higher |
| First-pass resolution rate | Claims paid on first submission ÷ claims adjudicated | 90% or higher |
| Denial rate | Claims denied ÷ claims adjudicated | Under 5% is a strong goal; 5% to 10% is common |
| AR over 90 days | AR older than 90 days ÷ total AR | Under about 15% |
| Charge lag | Average days from date of service to claim submission | One to three days |
| Denial overturn rate | Appealed denials paid ÷ denials appealed | Track the trend; a falling rate means weak appeals |
| Point-of-service collections | Patient amounts collected at the visit ÷ patient amounts due at the visit | Collect copays at every visit |
| Cost to collect | Total billing costs ÷ total collections | Track the trend; lower is better |
1. Net Collection Rate
The net collection rate, also called the adjusted collection rate, measures how much of the money you are contractually owed you actually collect. MGMA recommends a minimum of 95%. Use a rolling 12-month window, because payment timing makes single months noisy. A low rate points to denials that were never worked, timely filing write-offs, small balances left behind and patient balances that went to bad debt.
2. Days in AR
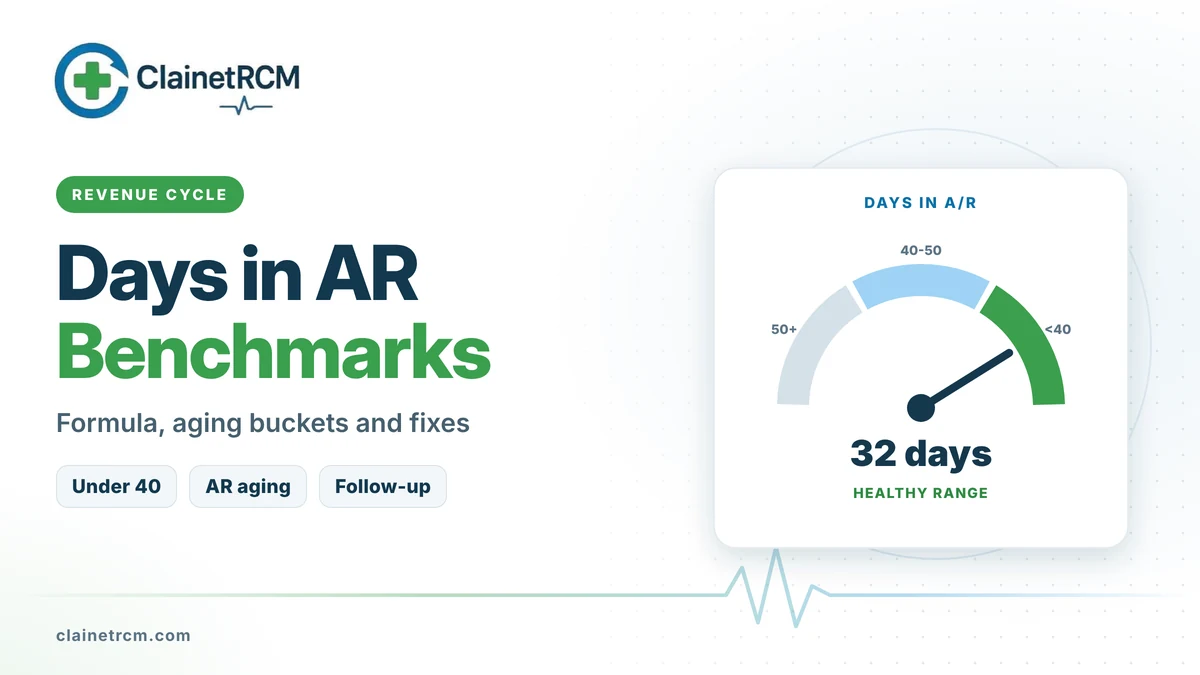
Days in AR shows how long it takes to get paid. Divide total AR by average daily charges, using the last three months of gross charges. Most physician practices aim to stay under 40 days. Read it next to your AR aging report, because a healthy average can hide a stack of very old claims.
3. Clean Claim Rate
The clean claim rate measures claims that pass clearinghouse and payer front-end edits on the first try. It is the most upstream metric on this list. Every point you gain here cuts rework, shortens days in AR and lifts your net collection rate. Low rates usually trace to registration errors, missing authorizations, invalid codes and payer-specific formatting rules.
4. First-Pass Resolution Rate
The first-pass resolution rate goes one step further: the share of claims that are paid, not just accepted, on the first submission. A claim can pass every edit and still be denied for medical necessity or coordination of benefits. A gap between your clean claim rate and first-pass resolution rate tells you the problem lies in coverage, documentation or payer policy rather than formatting.
5. Denial Rate
The denial rate is the share of adjudicated claims that payers deny. A rate under 5% is a strong goal, and many practices run between 5% and 10%. Track it by count and by dollars, and break it down by payer, provider, location and reason code. The reason codes tell you where to fix the process: eligibility, authorization, coding, documentation or timely filing.
6. AR Over 90 Days
This metric shows how much of your AR is aging into the danger zone. Many practices aim to keep AR over 90 days below about 15% of total AR and AR over 120 days near 10% or lower. Rising aged AR is an early warning that follow-up is falling behind or that one payer has stopped paying.
7. Charge Lag
Charge lag counts the days between the date of service and claim submission. Every day of lag adds a day to your AR. One to three days is a practical target for most outpatient practices. Long lag usually means unsigned notes, coding backlogs or missing charge capture from procedures done outside the office.
8. Denial Overturn Rate
The denial overturn rate is the share of appealed denials that end up paid. It tells you whether your team appeals the right claims with the right evidence. A low rate suggests you are appealing claims that should have been corrected and resubmitted, or appeals are missing the payer’s criteria.
9. Point-of-Service Collections
Point-of-service collections measure how much of the patient’s share you collect at check-in or check-out. Copays and known balances are far easier to collect at the visit than by statement. Give staff cost estimates before the visit, accept cards on file and text-to-pay, and track this metric by location and by front-desk team.
10. Cost to Collect
Cost to collect divides your total billing costs, including staff, software, clearinghouse fees, statements and any outsourcing fees, by total collections. Use it to compare in-house billing with outsourced options and to measure whether automation is paying off. Watch the trend rather than a single industry figure, because cost structures vary widely by specialty and size.
How to Build a Medical Billing KPIs Dashboard
- Pick one definition per metric and write it down, including the data source and date range.
- Report monthly and show at least 12 months of history so trends are visible.
- Slice by payer, provider and location. Averages hide the payer that changed its rules or the clinic with a new front-desk team.
- Pair metrics that check each other. Read days in AR with write-offs, denial rate with net collection rate, and clean claim rate with first-pass resolution rate.
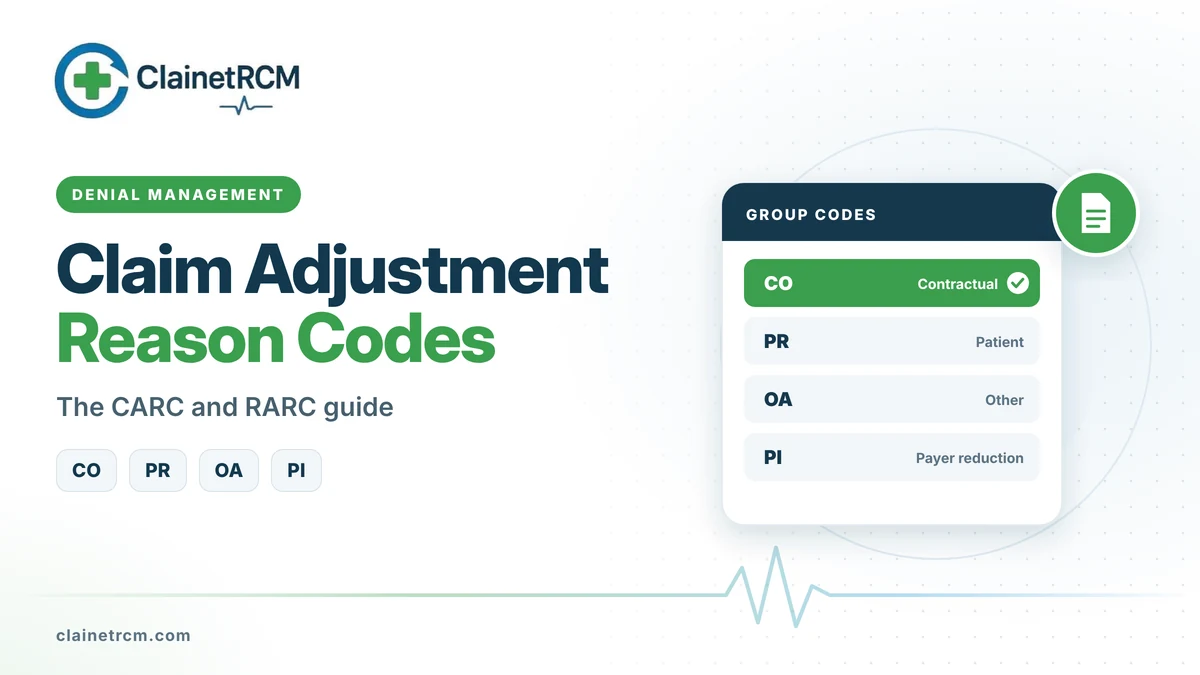
- Drill into reason codes. A dashboard should lead straight to the CARCs and RARCs behind each denial trend.
- Assign an owner and an action to every metric outside its target.
Red Flags to Act on Right Away
- Net collection rate below 95% for three months in a row.
- Days in AR rising for two or more months.
- A single payer with a denial rate far above your average.
- AR over 120 days growing while total AR stays flat.
- Charge lag longer than a week for any provider.
Frequently Asked Questions
Net collection rate, days in AR, clean claim rate, denial rate and AR over 90 days. Together they show how much you collect, how fast, and where claims break down.
95% or higher is the common benchmark, and top-performing practices often reach 97% or more. Calculate it with payments divided by charges minus contractual adjustments.
The clean claim rate counts claims accepted without edits or rejections. The first-pass resolution rate counts claims actually paid on the first submission.
Review them monthly, with a weekly check on denials and aged AR. Quarterly reviews are too slow to catch payer changes before they cost you money.
A good billing partner should report these KPIs to you every month and show the actions behind each change. Ask for definitions and raw data so you can verify the numbers.
Final Thoughts
Medical billing KPIs only help when they are measured consistently and tied to action. Start with the five core metrics, add the rest as your reporting matures, and review them every month with the people who can fix what they reveal. Our revenue cycle management services include a monthly KPI review and the work to improve it. If you are weighing outside help, read our guide on outsourced RCM for independent practices.
Know Your Numbers and Improve Them
We build a monthly KPI dashboard for your practice, explain what moved and fix the billing problems behind every weak metric.
Get an RCM Review
Written by
ClainetRCM Billing Team
ClainetRCM is a Boston-based revenue cycle management company specializing in medical billing, coding, credentialing and denial management for healthcare providers across all 50 states. Our AAPC and AHIMA certified team works inside your existing EHR, files claims within 24 to 48 hours and reviews every AR bucket on a 14-day cycle.